Technical Analysis
Candlestick Patterns
Candlestick charts show price movements and are essential for technical analysis. Each candlestick represents a period of time and shows open, high, low, and close prices.
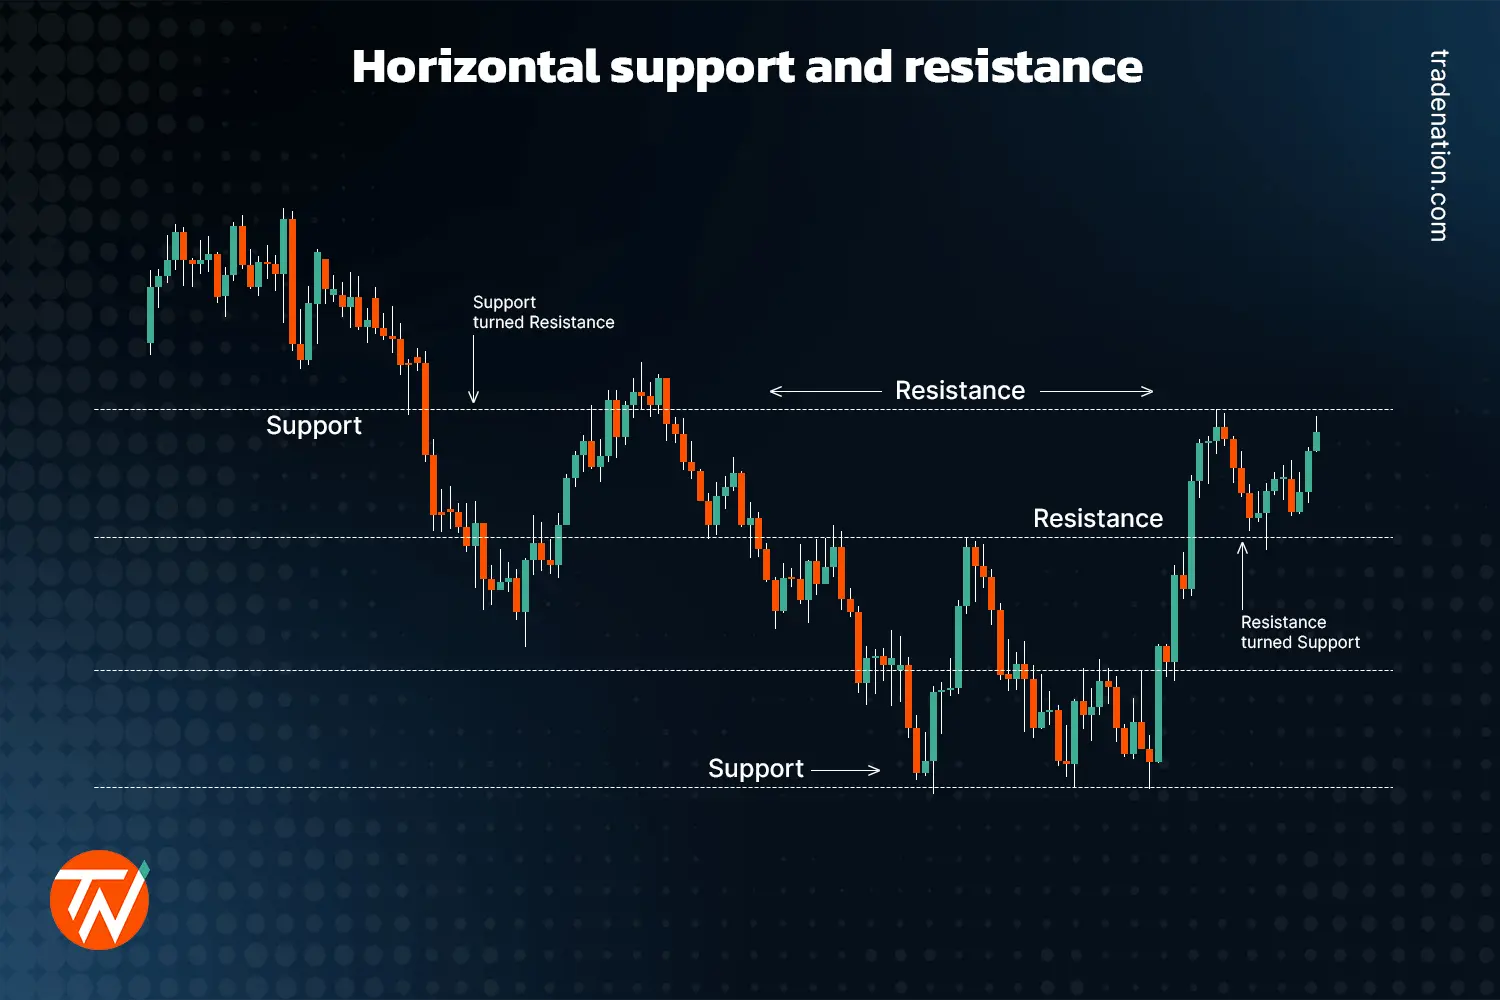
Example of various candlestick patterns and chart formations
Basic Candlestick Patterns
Bullish Patterns
- Hammer
- Bullish Engulfing
- Morning Star
Bearish Patterns
- Hanging Man
- Bearish Engulfing
- Evening Star
Technical Indicators
Moving averages smooth out price data to identify trends.
- SMA: Simple Moving Average
- EMA: Exponential Moving Average
- Golden Cross: When short-term MA crosses above long-term MA
RSI measures price momentum on a scale of 0-100.
- Above 70: Overbought (potential sell signal)
- Below 30: Oversold (potential buy signal)
- Between 30-70: Neutral
MACD shows relationship between two moving averages.
Components:
- MACD Line
- Signal Line
- Histogram
Signals: Crossovers, divergences, and histogram changes.
Chart Patterns
Continuation Patterns
- Triangles
- Flags
- Pennants
Reversal Patterns
- Head and Shoulders
- Double Top/Bottom
- Cup and Handle